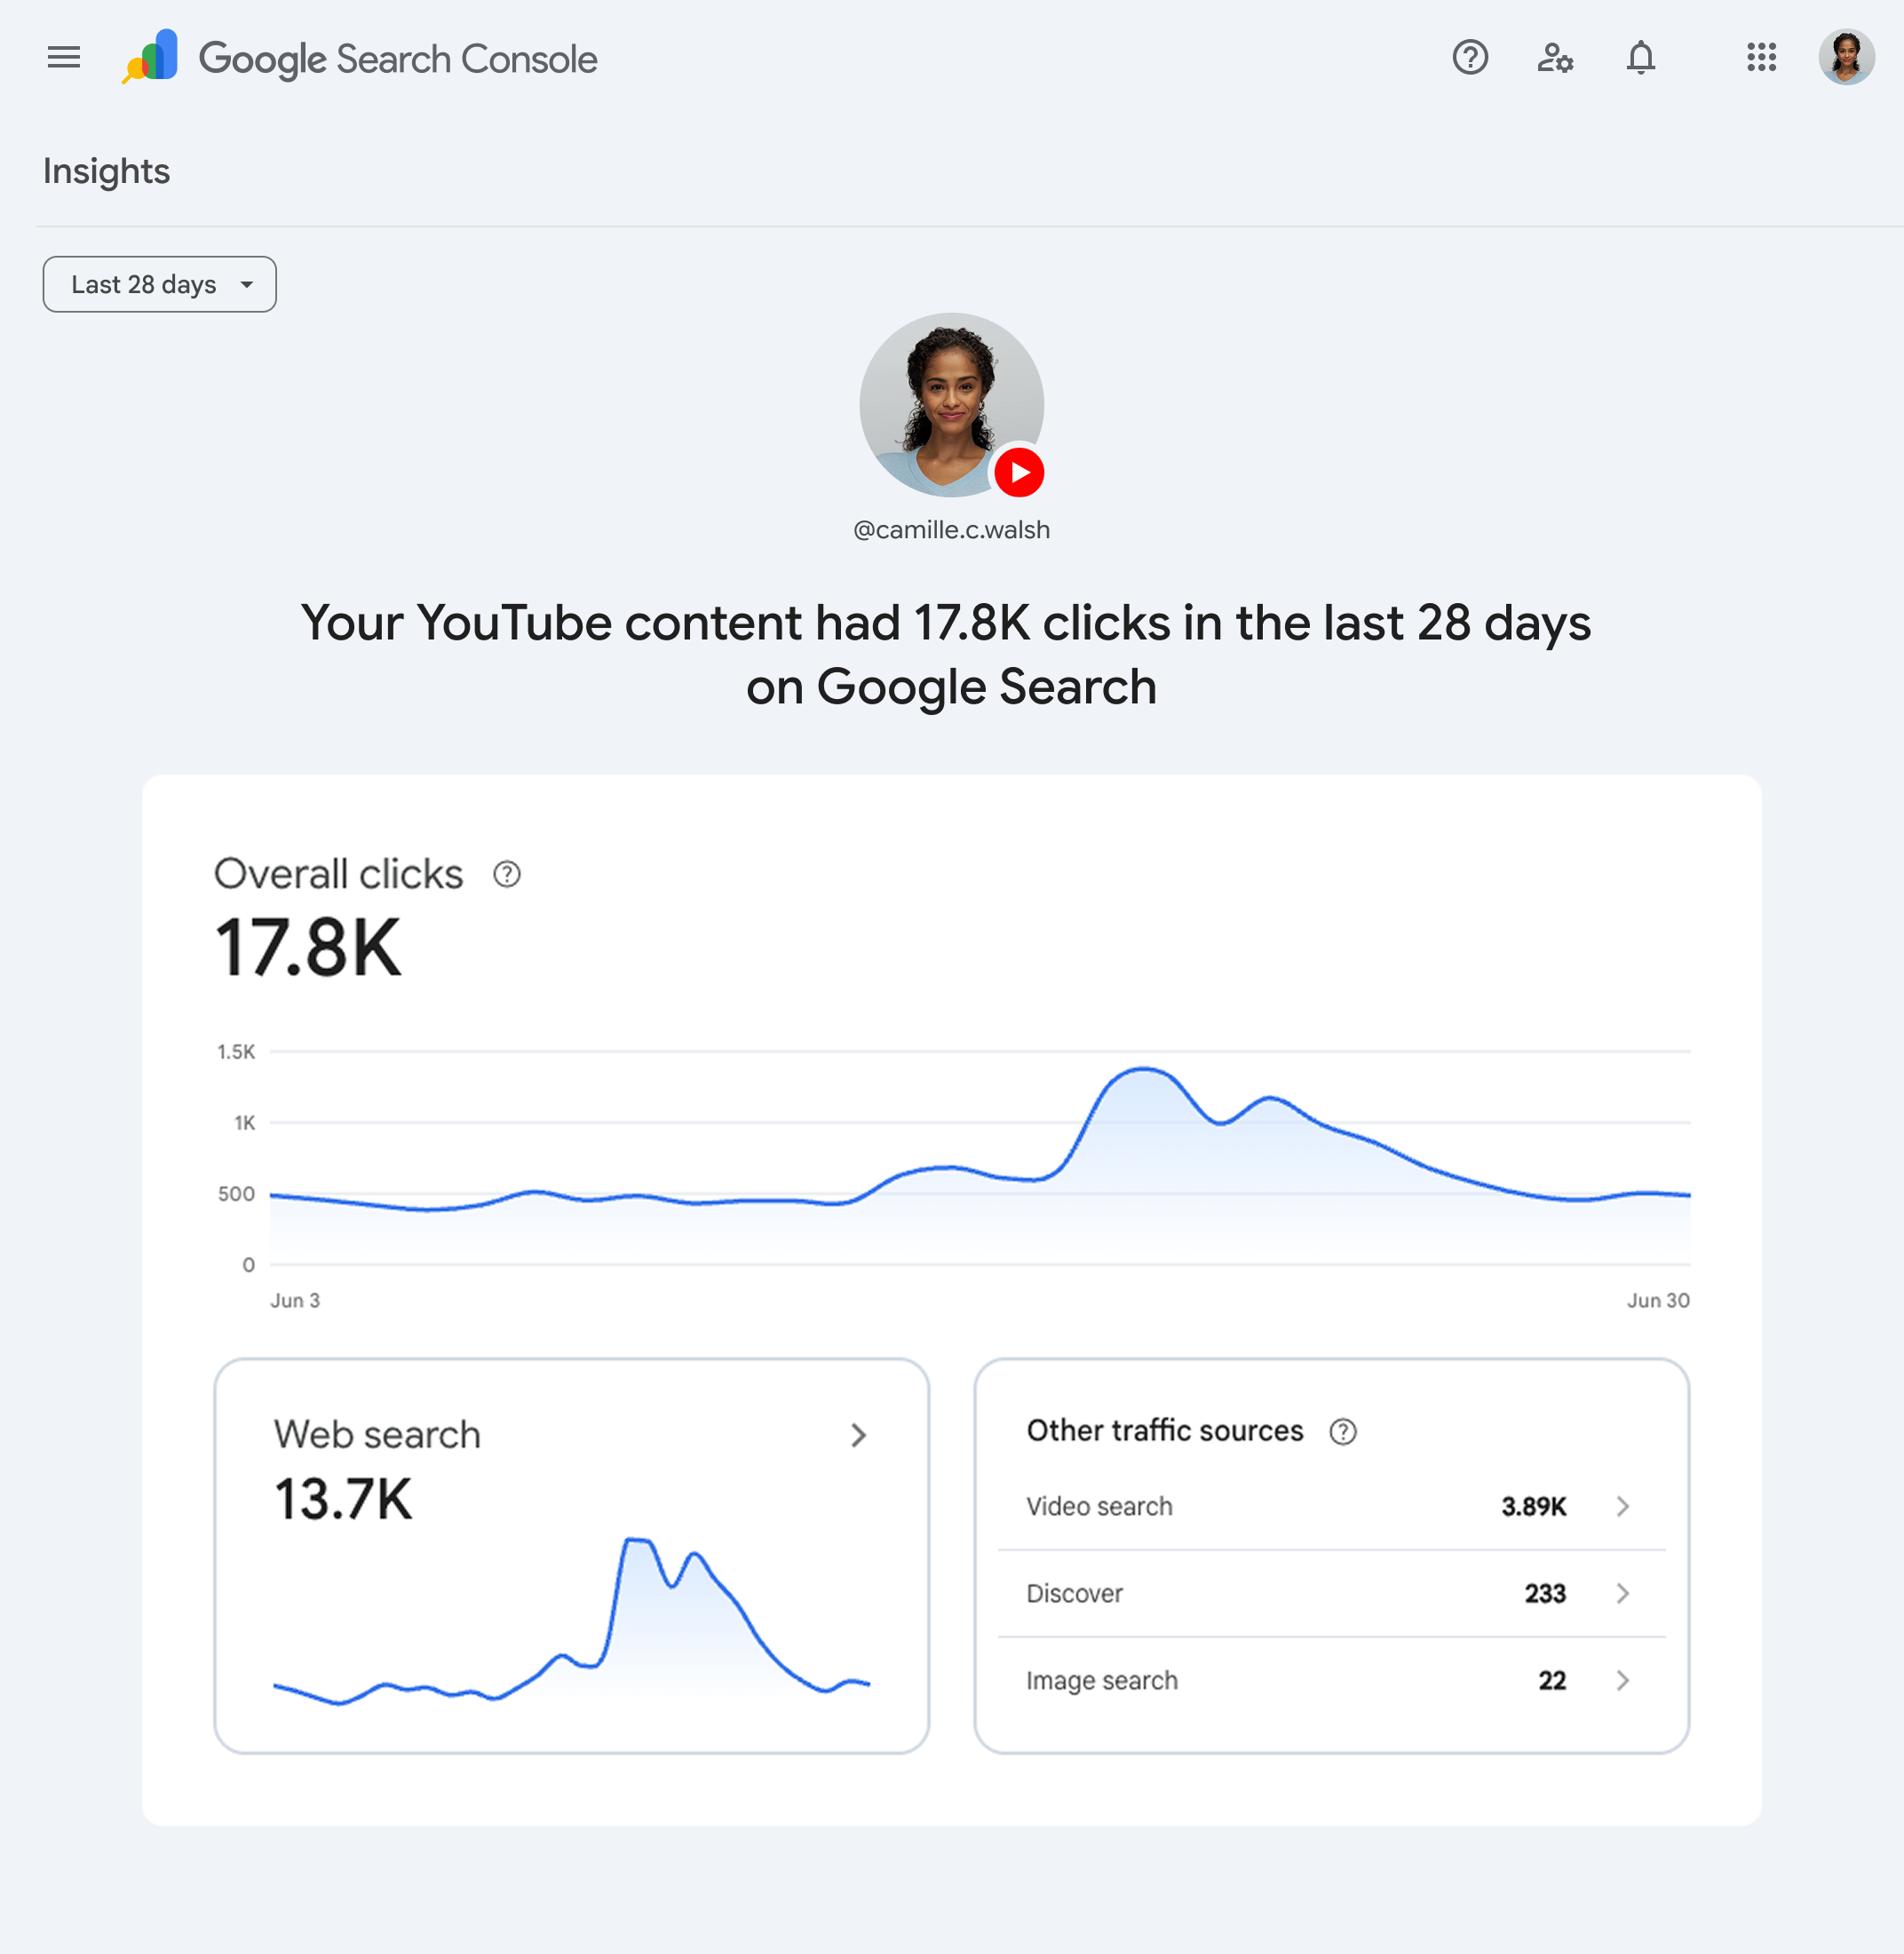
Process and organization

Last update

10 MIN.

Analytics in YouTube: A Complete Guide

Learn how to interpret YouTube data, track trends, and make informed decisions that drive engagement and growth for both your channel and videos!

Marvellous

Marvellous

Analytics in YouTube: A Complete Guide
Summary

Every minute, creators upload 500 hours of video to YouTube, making the platform very competitive. Standing out in this sea of content and growing your YouTube channel requires more than posting videos consistently!

So how can creators and brands rise above the noise and ensure their content reaches the right audience? The answer lies in YouTube Analytics.

Analytics in YouTube isn’t just a tool—it’s your roadmap to growth on the platform. In this guide, we’ll walk through the ins and outs of YouTube Analytics: from decoding YouTube metrics to actionable strategies for growth.

Let’s dive in!

What is analytics in YouTube?

Analytics in YouTube refers to the data and performance metrics that show how your channel and videos are doing. It provides insights into how people discover, watch, and engage with your content. This data is essential for understanding what’s working on your channel and where you can improve.

YouTube Analytics is essentially your channel’s report card. It turns numbers into insights. This will help you grow your audience and make content that connects better with viewers.

You can access your YouTube channel's statistics on desktop and mobile with YouTube Studio.

What is YouTube Studio?

YouTube Studio is your go-to place for everything related to your YouTube channel! It's where you can upload and manage your videos, tweak them to perfection, and keep an eye on how they're doing.

Think of it as your YouTube control center. You can upload videos, edit them, create playlists, make your channel look awesome, and even chat with your viewers. What interests us most here is that it gives you all sorts of stats and insights so you can see what's working and what's not! And if you're looking to make some money from your videos, YouTube Studio has got you covered there too.

How to see YouTube analytics​?

Here’s how you can access YouTube Analytics and navigate on both desktop and mobile.

How to see YouTube analytics​ on desktop?

You can view analytics directly from YouTube Studio, the central hub for managing your channel, uploading videos, and analyzing performance.

You can also access the analytics studio by logging into the YouTube account connected to your channel. If you’re wondering where is the YouTube studio site on YouTube, once logged in, navigate to your studio by clicking on your profile picture in the top-right corner. From the dropdown menu, select YouTube Studio.

How to find YouTube Studio in YouTube

In YouTube Studio, click on Analytics. Here, you will find detailed insights about your channel and videos.

How to find Analytics on YouTube Studio

The tabs at the top of the Analytics page focus on specific data.

  • Overview: Shows key metrics like views, watch time, and subscriber growth.
  • Content: Provides details about your videos, including impressions and click-through rates (CTR).
  • Audience: Offers insights about your viewers, such as their demographics, activity patterns, and return rates.
  • Revenue: For monetized channels, this tracks your earnings from ads and memberships.

How to see YouTube analytics​ on mobile?

Download the YouTube Studio app and sign in with the account linked to your channel.

Once logged in, you’ll land on the Dashboard. Tap the Analytics icon at the bottom of the screen.

How to find YouTube Analytics on mobile

This opens an overview of your YouTube channel analytics and performance metrics.

A look at YouTube Studio mobile app

25+ YouTube channel metrics explained

In YouTube Studio, the analytics dashboard is divided into different sections. Here is a breakdown of each section.

Overview metrics

The Overview section gives a snapshot of your channel’s overall performance. It focuses on key data points to provide a quick health check.

The overview section shows data for the previous 28 days.

  1. Views: The total number of times your videos were watched during a specific time frame.
  2. Watch time: The total hours viewers spent watching your videos.
  3. Subscribers: The number of new subscribers gained or lost.
  4. Top content: A table at the bottom of the overview section shows your top 10 content in the previous 28 days. It also displays the video’s average view duration and views.
  5. Realtime views: A rolling update of views on your channel in the last 48 hours. It is useful for tracking the immediate impact of new uploads.

Content metrics

The Content section provides detailed data on how your overall content is performing.

A look at Content Analytics in YouTube Studio
  1. Impressions: The number of times your video thumbnail was shown to viewers. This metric measures how often your content is visible across YouTube.
  2. Impressions click-through rate (CTR): The percentage of impressions that led to video views. A high CTR indicates that your thumbnail and title are effective.
  3. Average view duration: The average time viewers spend watching a video. It indicates how engaging your content is overall.
  4. Key moment of audience retention: Shows how different moments of your video held the attention of viewers. For example, you can see how many viewers are still watching your videos after 30 seconds. Videos with high audience retention are more likely to do well because they tell the algorithm that audiences enjoy the content.
  5. Traffic sources: Breakdown of where your views are coming from.
    1. YouTube search: Views from search queries.
    2. Suggested videos: Views from recommendations.
    3. External sources: Views from links on other platforms like social media or Google search.

Audience metrics

The Audience section provides insights into who is watching your videos and how they engage with your content.

A look at Audience Analytics in YouTube Studio
  1. Unique viewers: The estimated number of new people who watched your videos during a specific period. If unique viewers grow over time, your audience is expanding.
  2. Returning viewers: The number of viewers who watched your channel more than once in a given period. Returning viewers indicate audience loyalty. A higher number suggests your content is compelling enough to keep viewers coming back.
  3. Subscribers: Tracks how many people subscribed or unsubscribed from your channel during a specific time.
  4. When your viewers are on YouTube: This data shows the days and times when your audience is most active on the platform. By using it to optimize your upload schedule, you can post during peak activity times, increasing the likelihood of your video being watched shortly after it’s uploaded. This early engagement helps your video gain momentum in the algorithm more quickly.
  5. Demographics: Details about your viewers’ age, gender, and location. Demographics allow you to tailor content to your audience. For example, younger audiences may prefer fast-paced editing, while older viewers may value in-depth explanations.
  6. Top geographies: Data on your viewer's location broken down by country. This insight allows you to time your uploads to align with your viewers’ time zones, maximizing engagement.
  7. Watch time from subscribers: The percentage of your total watch time that comes from subscribed versus non-subscribed viewers. A high percentage of watch time from subscribers shows strong audience loyalty. If most of your watch time comes from non-subscribers, you may need to focus on converting viewers into subscribers.
  8. Other channels your audience watches: Shows a list of channels your viewers also watch regularly. These channels can be a good source of inspiration. They provide insight into your audience’s interests and preferences. Use this information to create content similar to what they already enjoy.

YouTube video analytics

To see the performance of each video on your channel, select “Content” in the left-hand menu of YouTube Studio.

How to see video analytics in YouTube Studio

For the breakdown of metrics for any video, tap the Analytics icon next to the thumbnail.

How to find analytics for each YouTube video

These metrics will help you identify what works so you can optimize future videos.

Video analytics in YouTube Studio
  1. Views: The total number of times your video has been watched.
  2. Watch time: The total hours viewers spend watching your video. Watch time is a key factor in YouTube's algorithm. Videos with higher watch time are more likely to be promoted in search results and recommendations.
  3. Traffic sources: Data on how viewers find your video. With this knowledge, you can focus on optimizing for specific sources like search or external platforms.
  4. Impressions, the number of times your video thumbnail is shown on YouTube, and Impressions CTR, the percentage of impressions that lead to views. High impressions with a low CTR suggest your thumbnail or title might need improvement.
  5. Engagement metrics:  Engagement is a strong indicator of your video's impact. High engagement helps your video rank better and fosters community interaction. Engagement metrics include basic metrics such as likes (.vs dislikes), shares, and comments. There is also Audience retention. It is the percentage of your video that viewers watch before dropping off. The metric shows how engaging your video is. A high retention rate means viewers stay interested, while drop-off points indicate areas that need improvement.
  6. Average view duration: The average amount of time viewers spend watching your video. This metric helps you understand whether your content is engaging enough to hold viewers' attention. Longer durations indicate interesting and quality content.
  7. Audience demographics: Data about the age, gender, and location of viewers for a specific video.
  8. Subscribers: The number of subscribers gained (or lost) from a specific video. It shows how effective your video is at converting viewers into subscribers.

YouTube analytics tools to improve your video performance

While analytics in YouTube Studio provides detailed insights into your channel’s performance, other analytic tools offer additional features and perspectives. Features like competitor analysis, enhanced keyword optimization, and scheduling. These tools help creators refine their strategies, uncover deeper insights, and maximize their channel’s potential.

Iconosquare

Very soon, you'll be able to analyze the statistics and do the reporting of your YouTube channel and videos on Iconosquare! The social network will soon be joining the ranks of social networks supported on our platform. ❤️

TubeBuddy

TubeBuddy tool

TubeBuddy is an all-in-one browser extension designed for YouTube creators. It simplifies keyword research, SEO, and video optimization. Key features include A/B testing for thumbnails and titles.

Social Blade

Social Blade tools

Social Blade provides growth projections and YouTube analytics for other channels. Key features include estimated income tracking for monetized channels, channel comparisons to benchmark against competitors, and historical data for views, subscribers, and earnings.

How to turn YouTube analytics into action?

Analytics in YouTube provides a wealth of data that can transform how you create and share content. However, metrics alone won’t grow your channel. It’s how you interpret and act on them that makes the difference.

Here are some tips to help you use YouTube Analytics to improve your videos, engage your audience, and grow your channel.

1. Understand the metrics that matter

Before diving into actions, you need to identify the metrics most relevant to your goals. We’ve already seen these metrics earlier in the article. They help you see where your content excels and where there’s room for improvement. Focus on what matters most for you.

2. Craft better thumbnails and titles

Metric to watch: CTR

If your CTR is very low, your thumbnails or titles might not be compelling enough. This is a missed opportunity since CTR directly impacts how often YouTube recommends your videos.

How to improve your CTR?

  • Upgrade thumbnails: Use bright colors, bold text, and clear imagery that reflects your video’s content. If you are not great with Photoshop, Canva is a good alternative for designing thumbnails.
  • Test titles: Write titles that spark curiosity or promise a clear benefit. For example, instead of "My Morning Routine," try "How a 5-Minute Morning Hack Changed My Day."
  • A/B testing: Test multiple thumbnails and titles to see what resonates most with your audience. YouTube now offers an A/B test feature for thumbnails. Creators can upload a video with up to 3 thumbnails for testing. After the test is completed, you can choose the highest-performing thumbnail.

3. Keep viewers watching longer

Metric to watch: Audience retention

A drop in your audience retention graph indicates where viewers lost interest. This data is crucial for improving future videos.

How to improve your audience retention?

  • Hook viewers immediately: Start your video with a strong, engaging intro that grabs attention in the first 10 to 30 seconds. Remove unnecessary filler and focus on delivering value quickly.
  • Add visual interest: Use jump cuts, on-screen graphics, and dynamic camera angles to maintain viewer attention. The average viewer has a short attention span, so using these ‘tricks’ will help keep them engaged.

4. Tailor content to your audience

Metric to watch: Demographics and audience activity

Understanding who watches your videos and when they’re most active allows you to align your content to meet their preferences.

Use data on age, gender, and location to craft content that speaks directly to your viewers. For instance, if most of your audience is from a specific region, they might appreciate content that reflects their local culture or interests. On the other hand, universally relatable topics are perfectly fine if you have a more global audience.

Also, use the ‘When Your Viewers Are Online’ data in YouTube Analytics to schedule uploads during peak activity times. The more subscribers are online when you upload, the more initial traction your videos get.

5. Engage viewers to build a community

Metric to watch: Likes, Comments, and Shares

Engagement metrics indicate how much your audience interacts with your content. More engagement translates to increased visibility.

How to improve audience engagement?

  • Ask questions: Include a specific question in your video to encourage comments. For example, "What’s your favorite tip from this video? Let me know in the comments!"
  • Respond to comments: Engaging directly with your viewers allows you to build stronger connections with them.
  • Encourage sharing: End your videos with a call to action, such as "If you found this helpful, share it with a friend."

6. Replicate what works

Metric to watch: Top-performing content

Use analytics to identify your best-performing videos. These are the ones with the highest views, watch time, and engagement.

Look at the topics, formats, tone, and even length of your top videos. Use the insights from these videos and replicate successful elements in new videos. If a specific topic is performing exceptionally well, consider creating a series around it.

7. Track subscriber growth

Metric to watch: Subscribers

Having a strong subscriber base ensures you get a consistent stream of views when you upload new content. Unlike casual viewers, subscribers are invested in your channel and more likely to watch your videos regularly. They are your dependable viewers and form the foundation of your channel’s growth.

How to get more subscribers on YouTube?

  • Create subscription-worthy content: Focus on high-value and interesting topics.
  • Build a consistent upload schedule.
  • Identify which videos drive the most subscriptions and create more like them.
  • Use calls to action: Prompt viewers to subscribe. It can be as simple as that.

Frequently asked questions about YouTube analytics

What does “channel pages” mean?

This metric is displayed in YouTube Analytics under Traffic Sources and represents views generated when users visit your channel page and watch your videos from there. (They didn’t come across your video from the home page, suggestions, or search.)

To optimize your channel page for more traffic, highlight your best videos as featured content. You can also organize videos into playlists to make navigation easier.

What are browse features?

Browse features is a metric displayed in traffic sources. It tracks views coming from specific browsing locations within the platform such as YouTube’s main homepage, subscription feed, or other browsing areas. It is an indicator of how well your content is performing in YouTube's algorithm-driven spaces.

Wrapping up

Understanding YouTube analytics is a game-changer for any creator or brand looking to grow its presence on the platform! The key thing to remember is that tracking key metrics isn’t enough. You need to transform these raw data into insights and act on them. Doing this will help you grow your channel and ensure long-term success.

About
the writer
Marvellous

Marvellous

Copywriter @Iconosquare

Hi! I'm Marvellous, huge fan of Iconosquare as a product, and determined to help experienced social media marketers thrive in the various aspects of their career.

Subscribe
for weekly updates

Get your weekly dose of quality content in the form of blog articles, podcast episodes and expert tips and tricks. Why hesitate? Sign up now!

Thank you !
Oops! Something went wrong while submitting the form
Emily Marsh
Icon ESm2

Discover our podcast

Every week, Emily interviews top brands, renowned influencers, and hidden agencies with one goal in mind: to understand what happens backstage of their social media strategies.

Listen to esm2
Social Media Calendar

Social Media Calendar

Get your hands on our free, downloadable 2025 Social Media Calendar with over 450 trending dates, all preloaded and ready to use.

Download for Free
Customer stories

Customer stories

Read about how other business, agencies and entrepreneurs were able to level up their social media game with the help of powerful analytics and expert strategies.

Inspiration this way
YouTube tutorials

YouTube tutorials

Need a hand using the multiple features Iconosquare has to offer? Wondering how you can use them to maximize your perfromance on social media? Check out our tutorials on YouTube.

Best pratices

How do you perform on social media?

Find out in a minute using our audit.

How data-driven social media marketers get the job done