





Bridging the gap between theory and the real social media job: inside a university program
100 accounts
managed hands-on by students
+37%
average engagement rate
+29%
reach growth


"You cannot improve a strategy without measuring what you do. Data provides evidence, and it is where every action plan should start."

Michel D'Urso has taught social media marketing at Hénallux, in Namur, Belgium, for seven years. Alongside teaching, he works as a freelance consultant in web strategy, digital marketing, AI and data. He uses Iconosquare every day for his own clients. His teaching philosophy fits in one line: you can only steer what you measure.
In class, his goal is to show future professionals how data can challenge intuition, validate hypotheses and guide better decisions.
The context and challenge: giving students a true taste of the field, from year one
Michel's course sits within a three-year bachelor's program in marketing and runs on a simple principle: you learn by doing, and above all by getting things wrong. For most of his 200 students, this is their very first experience managing social media accounts. So the challenge isn't only technical. It's about learning to think in nuance.
A telling example: "Nobody uses Facebook anymore." With the statistics in front of them, students discover reality is more complex than the received wisdom. That ability to reason from data rather than assumptions is exactly what Michel wants to pass on.
Before Iconosquare, the course relied on Meta's native Business Suite. It worked, but it came with two significant limits:
- A persistent gap between the theory taught and the professional tools students would meet in the workplace. Tracking content pillars — which category performs, which format works, how to adjust — was hard to structure.
- Time-consuming manual work. Calculating an engagement rate by hand, compiling each group's results, comparing performance over time: all of it drained energy away from what actually matters: analysis and recommendations.
That trade-off had real stakes, because the course is graded on demanding criteria:
- the quality of the diagnosis;
- the relevance of the action plan;
- the quality of the publications;
- the strength of the recommendations.
Without the right tool, too much of the students' energy (and Michel's grading time) went into mechanics rather than thinking.
The solution: a professional tool in the hands of future professionals
Michel was already using Iconosquare for his clients, following a benchmark of the market. Beyond the platform itself, it was the human contact with the Iconosquare team that convinced him to bring it into the classroom.
The learning objective is clear. By the end of the semester, students should be able to:
- create engaging content across social networks;
- build every step of a strategy starting from SMART objectives;
- define relevant KPIs for social media.
For Michel, Iconosquare's biggest strength is its data-first logic, which becomes the thread running through the whole exercise: start from the numbers, then turn them into concrete recommendations.
The final stage of the project is exactly that: preparing for life "after the student takeover," recommending content types, formats, and a cadence based on what the data shows.
Crucially, students work on real accounts, not fictional cases. Around 200 students, working in teams, manage approximately 100 real social media accounts. Each team supports two client accounts: entrepreneurs, freelancers, and small local businesses that aren't yet supported by professionals (like restaurants, hair salons, B2B shops).
Most projects run on Instagram and Facebook, then TikTok, and only rarely LinkedIn. Students learn that there is no universal social media KPI: the right metric depends on the client’s objective, audience and stage in the customer journey.
To run these projects, they lean on three parts of the platform in particular:
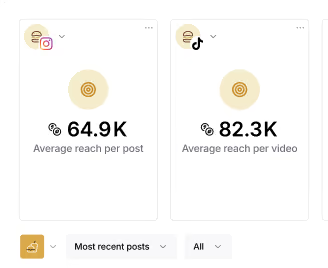
- Social media analytics, to build a data-backed diagnosis and track how accounts evolve.
- Social media reporting, whose drag-and-drop building and dashboards, adaptable to each client's objectives, are especially appreciated.
- Campaigns, to track content pillars: which category of posts performs, and how to make the most of it.
One real plus for academic use: the pro version extended to six months, which gives a full cohort time to train under genuinely professional conditions.
The results: from data endured to strategy owned
Quantitative impact
Across comparable accounts and measurement periods, student led projects generated an average 37% increase in engagement rate and a 29% increase in reach. Setting the accounts up in Iconosquare before the students take over, then measuring the change a few months later, is a powerful motivator: students can see, with the numbers to prove it, what their work changed.
Some results go well beyond expectations! One student post reached 2.5 million views. What surprises Michel most, in a course this data-driven, is the creativity it unlocks: codes, memes, native formats. Far from boxing in inventiveness, the analysis feeds it.
The viral result also becomes a learning opportunity: students are asked to look beyond views and assess whether the content reached the right audience, generated meaningful interactions and contributed to the client’s objectives.
Impact on employability
Students complete a three-month internship in their third year, and many use Iconosquare, the tool they discovered in year one, straight away on the job. Mastering a professional platform becomes a genuine differentiator in the job market.
Qualitative impact
This may be where the shift is clearest. By handling a professional tool, students grasp the value of data first-hand. They're often surprised by their own strong results, because they get tangible feedback through engagement and reach, far more meaningful than a simple follower count.
The time saved matters just as much. Rather than calculating an engagement rate by hand, students let Iconosquare do it and focus their energy on the work that counts: the analysis, the strategy, the recommendation.
Using software that professionals genuinely rely on is also deeply motivating for them. Students are also encouraged to question the limits of platform data and consider privacy, consent, copyright and transparency when using AI assisted content.
What's next?
Michel's next big teaching challenge is AI. Since the widespread adoption of generative AI, Michel has observed a growing tendency toward more polished, but also more standardized content. The challenge is therefore no longer simply to teach students how to use AI, but how to question its outputs, protect a distinctive tone of voice and add genuine human value.
Knowledge bases, AI-assisted tools, shared calendars… The goal is to train professionals who can protect their authenticity and their own tone of voice, and avoid the trap of everything starting to look the same.
Iconosquare will stay at the heart of that program in the years ahead. The "pro tool, real data" approach will keep shaping the course, around one non-negotiable principle: data is fact. And we couldn't be happier!
Michel imagines his students reusing these skills throughout their careers, adding nuance to how they understand an audience, building a strategy, producing an action plan and recommendations, and above all, relying on a proven methodology that helps hit objectives while limiting the risk of missing them.
His advice to teachers hesitating to bring in a new tool? The learning curve is very fast, for a high return in value. "Iconosquare is not an over-engineered machine."

"The fear, with a new tool, is complexity. With Iconosquare, a few students can understand the platform’s main logic within a first onboarding session and begin extracting useful insights very quickly. The effort-to-benefit ratio is excellent — and putting a professional tool in the hands of future professionals is a real advantage."
%201.svg)

%201.svg)
%201.svg)