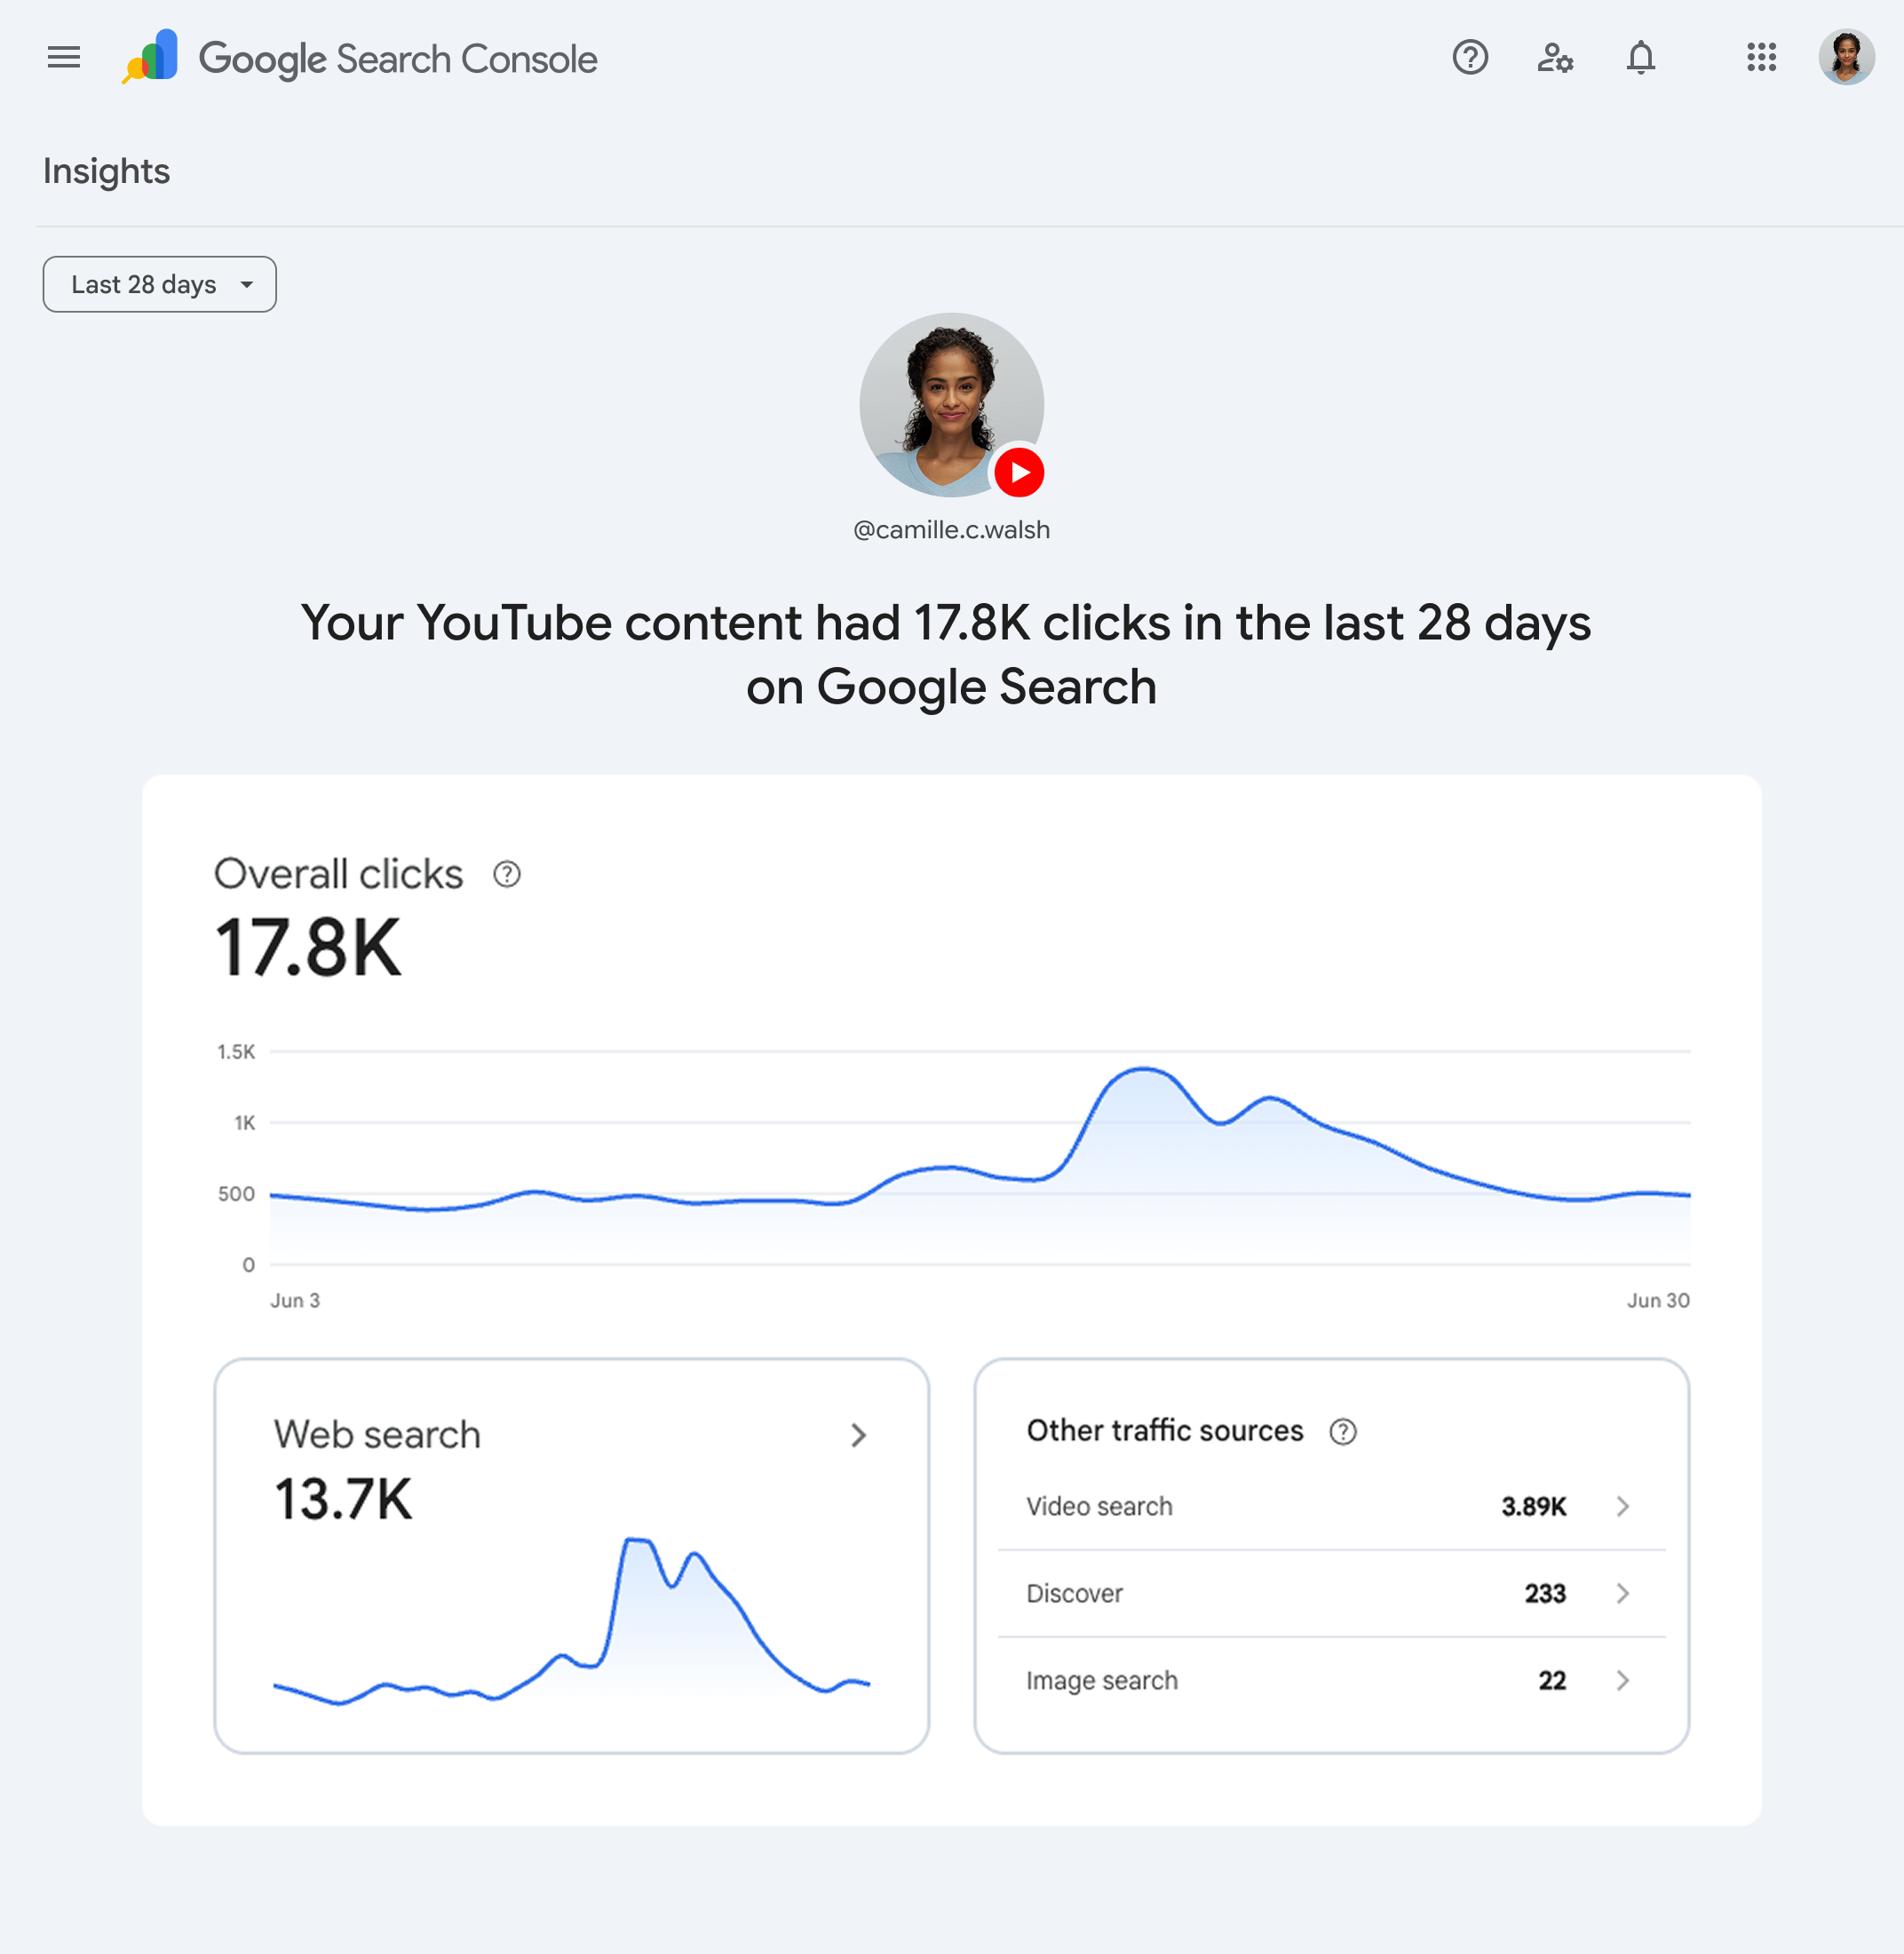
Google Search Console Can Now Show How Your Social Content Performs In Search
08 MIN.

From engagement to audience growth, unlock the power of social media metrics across platforms. Transform raw data into strategic wins with expert tips to boost performance and drive measurable results.

The magical world of social media analytics! It's as fascinating as it can be confusing.
This guide will break down the key social media metrics you need to track across multiple profiles. Everything will be much clearer for you after reading our expert advice. It will help you cut through the noise and focus on the numbers that drive real results.
Whether you're running a personal brand, managing a business account, or overseeing multiple client pages, understanding these insights will help you refine your strategy, maximize engagement, and make sense of your social media performance.
Let’s dive in.
Social media metrics are quantifiable data points used to measure a brand's performance, impact, and effectiveness across social platforms.
When many people think of social media metrics, they picture “likes” and “follower counts” first. While these numbers can offer a quick snapshot of your social media presence, they often only scratch the surface.
Likes are frequently referred to as vanity metrics because they look impressive at a glance but may not necessarily translate into meaningful outcomes like sales.
Of course, follower growth and likes are important for brand recognition and validating social proof. Still, on their own, they don’t tell you whether your content is leading to deeper audience engagement or concrete business results in your social media reporting!
To truly understand your social media performance, you need to analyze actionable metrics that tell you how audiences are reacting, what content types and actions they’re taking, and how these interactions align with your brand’s broader goals.
Without metrics, you can’t prove whether your social media marketing campaigns are working or even identify underperforming content.
Social media metrics quantify your impact. They turn subjective opinions ("Our Instagram looks great!") into objective truths ("Our Instagram engagement rate increased by 22% last quarter").
Here are other reasons why tracking social media metrics is non-negotiable.
Social media platforms act as powerful amplifiers for your brand voice, products, or services. Metrics like reach and impressions will let you know how visible your brand is. If your posts consistently reach more users over time, it’s a strong sign that your brand awareness is growing.
The journey from awareness to conversion usually starts with getting your brand name and offerings in front of potential customers. If they never see or hear about you, they can’t consider buying from you later.
Not all posts are created equal. Certain formats (like videos, reels, or carousel posts) may perform better on some platforms than others. By analyzing how each post performs, you can refine your content strategy. Over time, these patterns help you zero in on the specific content themes, styles, and formats that produce the strongest results.
Monitoring content performance data doesn’t just help you optimize the present, it also informs your future direction. Testing and learning from each post can shape a stronger, more targeted editorial calendar that drives better results over time.
![Social Media Calendar Template A plug-and-play template to help you build, grow and engage your audience on social media like a pro! Plan, schedule, and organize your content across platforms-weeks or months in advance.{{ include_custom_fonts({"Gilroy":["Audacieux","Moyen","Semi-gras"]}) }}](https://hubspot-no-cache-eu1-prod.s3.amazonaws.com/cta/default/143669362/interactive-252727309515.png)
Monitoring and analyzing social media metrics will impact your marketing budget and resource distribution. For instance, if analytics show that Instagram yields higher engagement and leads for a particular audience segment, you might allocate more time and ad spend to the platform.
Conversely, if a channel produces minimal clicks or conversions, you can re-evaluate whether you need to shift focus or adjust your approach to that platform.
Regularly reviewing metrics ensures that budget decisions are backed by evidence. Rather than distributing funds based on assumptions, you’ll have quantifiable proof of what’s working.
The ultimate goal of any marketing effort is to drive tangible results, such as sales, sign-ups, downloads, or leads.
Metrics like conversions, click-through rates (CTR), and cost-per-acquisition (CPA) reveal how your social media activities directly support your bottom line. When you track these numbers alongside awareness and engagement data, you gain a more holistic view of your social media ROI.
Brand awareness is often the first goal of any social media marketing strategy.
Simply put, the more people who know about your brand, the larger your potential customer base becomes. Brand awareness metrics help you gauge how visible and recognizable your brand is in the digital space and whether that visibility is increasing over time.
Here are brand awareness metrics you should monitor.
Reach and impressions are two of the most commonly tracked metrics for brand awareness:
Impressions are a useful metric to track for campaigns designed to increase recognition or recall of a new product, slogan, or ad series. You can monitor whether people see your content enough times to remember it.
💡 If you are confused about the difference between impressions and reach, think of it like this: If you spot the same post three times in your feed, that’s three impressions recorded, but you, as a unique viewer, will count as one person reached.
If people are mentioning your brand without being prompted by a contest or campaign, it indicates genuine interest and recognition.

The simplest way to calculate SOV is:
Scenario:
You run a coffee brand and want to calculate your SOV in the "organic coffee" category for Q3.
Your SOV = (1200/2600) x 100 = 46.15%
Your brand owns 46.15% of the conversation in the organic coffee category.
Social media engagement metrics measure how actively users interact with your content. While brand awareness metrics tell you how many people see your posts, engagement data sheds light on how deeply those viewers connect with what you’re sharing.
Here are engagement metrics you should monitor.
Likes and reactions are a quick form of positive feedback (e.g., Facebook “Likes,” Instagram “Hearts,” LinkedIn “Reactions”). Although viewed as vanity metrics, likes and reactions signal initial viewer interest. An uptick here can confirm that a post’s topic or format resonates with the audience.
Comments and replies are written responses from your audience, whether it’s a question, praise, criticism, or general feedback. They open a direct line of communication that can lead to community-building, richer conversations, and provide valuable insights on your audience.
These are the instances where users distribute your content to their feed or to other users.
Shares significantly broaden your reach by tapping into users’ extended circles. They also act as a form of social proof. When someone shares your content, they are effectively endorsing it to their peers.
Video views refer to the number of times a video is played, while watch time is the cumulative duration that users spend viewing it. A high view completion rate indicates strong content relevance and audience engagement.
Engagement Rate (ER) = (Total Engagement (likes + comments + shares, etc.) / Total Followers ) x 100
A post with 1,000 likes might seem impressive until you realize the account has 500,000 followers. The engagement rate of this post will be relatively small when compared with an account with 5000 followers getting 500 likes.
Conversion metrics are what tie social media activities directly to tangible business outcomes. A “conversion” can mean different things depending on your social media goals.
It can range from actual product purchases to newsletter sign-ups or registrations for an event. Tracking conversion metrics allows you to see exactly how your social presence directly contributes to your bottom line.
Here are social media conversion metrics you should track.
CTR is the ratio of users who click a link in your post or ad to the total number of impressions or reach.
A high CTR indicates that your call-to-action (CTA) and content are compelling enough for users to take the next step. It’s often the first measure of how well you’re moving audiences from social media to your desired landing page or website.
How to calculate CTR?
CTR = (Number of Clicks / Impressions) x 100
Conversion rate is the percentage of users who take a desired action (purchase, sign-up, etc.) after clicking through from a social media post or ad.
Conversion rate is arguably the most critical metric for ROI-focused campaigns. It tells you how efficiently your social traffic converts into actual results.
How to calculate conversion rate?
Conversion rate = (Number of Conversions / Total Clicks) x 100
This is how much you spend to generate a single conversion. In paid advertising, this is often referred to as cost per conversion (CPC) or cost per acquisition (CPA).
This metric is crucial for budgeting and calculating if you are making a profit. Knowing your CPC/CPA helps you understand the return on investment of your social media campaigns.
How to calculate CPA?
CPA = Total Ad Spend / Number of Conversions
By monitoring CPA in real time, you can adjust your ad targeting, bid strategy, or creative elements to improve ad efficiency.
ROAS specifically calculates how much revenue you earn for every dollar spent on advertising.
ROAS is an important metric to measure for any business where revenue is the immediate goal. It provides a clear snapshot of whether your campaign is netting a positive return.
How to calculate ROAS?
ROAS = (Revenue from Ad Campaign / Total Ad Spend) x 100
Social media is an effective tool for resolving customer issues.
Customers also expect a good experience when they reach out to a brand on social media. According to a PWC survey, 32% of customers say they stop buying from a business or using their product if they have a bad customer experience.
To make sure you are serving customers well on social media, here are the metrics you should track.
This is the average amount of time it takes for your brand to reply to a user’s query or comment on social media.

Consumers today expect near-instant support on social channels.
A delay, especially for time-sensitive issues can amplify frustration. Set up notifications or dedicated monitoring to ensure timely responses.
Response rate is the percentage of customer inquiries, mentions, or direct messages that receive a response from your brand.
How to calculate response rate?
Divide the number of inquiries you respond to by the total number of inquiries received within a specific period.
If you run social media for your brand across multiple platforms, it's easy to miss interactions with your audience. Iconosquare will allow you effortlessly manage all your interactions and conversations in one place.
Resolution time is the duration of time from when a customer raises an issue to the moment it’s resolved. A swift, effective resolution can convert an unhappy customer into a brand advocate.
CSAT rating measures a customer’s satisfaction with a recent interaction with your service agent.
A high CSAT implies agents effectively addressed queries, while a low CSAT signals potential training gaps or communication issues between agents and customers.
How to track CSAT:
After resolving an inquiry on social media, send a survey link or direct message with a one-click rating system (e.g., “rate your experience 1–5”). It's better to keep surveys short and easy. This will increase the likelihood of responses.

NPS measures how likely customers are to recommend your brand to friends or colleagues, usually on a scale from 0 to 10.
How NPS works:
Customers are asked, “On a scale of 0 to 10, how likely are you to recommend [Company/Product] to a friend or colleague?

Based on their answers, customers are categorized as:
How to calculate NPS?
NPS score = (Promoters - Detractors / Total Respondents) x 100
Unlike basic engagement metrics (likes, shares, comments), sentiment analysis goes beyond what people are saying to uncover how they feel about your brand.
How to measure audience sentiment:
Unlike simple numerical metrics, social media sentiment requires a qualitative assessment of conversations, comments, and brand mentions. Sentiment can be categorized as:
How to calculate sentiment score?
Sentiment Score = (Positive Mentions − Negative Mentions / Total Mentions) × 100
Audience metrics are critical for understanding who interacts with your brand. Let’s break down the key audience metrics you should track across social media platforms.
This metric tracks how many new users followed your social media profile over a given period. A steady increase in followers means your brand is reaching new people and maintaining audience interest.

Tracking this is easy. Most platforms provide insights on new net followers, showing both gained and lost followers over time.
You should also monitor follower churn rate (how many people unfollow after a certain period). A high churn rate may indicate that your content isn’t resonating with your audience. By tracking when and why followers drop off, brands can make informed adjustments to improve engagement and retention.
Demographics include identifiers like age, gender, location, and language.
Knowing your audience’s age and interests will help you tailor your content appropriately. And in the instances where the content you create is attracting an audience that differs from your intended target market, you can adjust your messaging.
Growth rate shows how quickly your audience is expanding over time. Rather than looking at total followers, this metric tracks the rate of increase or decrease in your audience size.
How to calculate audience growth rate?
Audience growth rate = (New Followers Over Time/Total Followers at Start of Timeframe) x 100
Tracking social media metrics is essential for evaluating performance, optimizing content strategy, and proving the ROI of social media efforts. However, collecting data isn’t enough. You need a structured approach to ensure that the insights you gather lead to actionable improvements.
Here are some best practices for analyzing social media metrics.
Before diving into social media analytics, set clear goals that align with your business objectives. Without a well-defined purpose, tracking metrics can become a meaningless exercise.
Businesses should establish measurable goals that connect with broader marketing efforts.
💡 The best way to set objectives is by following the SMART framework.
The abbreviation stands for Specific, Measurable, Achievable, Relevant, and Time-bound. Instead of setting a vague target like “increase Instagram engagement,” a more structured goal would be: “Improve Instagram engagement rate by 15% over the next three months by incorporating more interactive content such as polls, reels, and live Q&As.”
Tracking social media metrics sporadically will lead to incomplete insights. Instead of taking a one-time snapshot, businesses should monitor performance over time.
Daily tracking can help monitor engagement spikes and audience reactions in real-time, while weekly tracking provides a better view of content performance.
Monthly reporting helps analyze audience growth, post consistency, and overall engagement trends, while quarterly deep dives offer an opportunity to evaluate ROI and long-term strategic goals.
Each social media platform has unique engagement behaviors and audience demographics, so it’s important to avoid a one-size-fits-all approach when analyzing performance.
Comparing metrics across different platforms will help brands understand where their audience is most engaged and where they might need to adjust their content strategy.
For example, a brand may find that its Instagram content generates higher engagement than X, indicating that visual content resonates better with its audience.
Raw data can be difficult to interpret, especially for stakeholders who may not be familiar with social media analytics.
Effective reporting should clearly present social media insights. It should highlight key metrics such as engagement, reach, conversions, and audience growth while also showcasing performance trends over time.
Use social media data gathered to refine content strategy and optimize performance.
A/B testing is a valuable tool for optimization. Testing different post captions, ad creatives, or posting times can help determine what resonates best with the audience. Social media trends evolve quickly, so continuous testing and adaptation ensure that brands stay ahead of the curve and maximize their digital presence.
Manually collecting and analyzing data from multiple platforms and profiles can be overwhelming. The right tools help streamline this process. Here are a few tools to help you track and analyze social metrics effectively.
One of the ways to track social media metrics is by using the built-in analytics tools provided by the social media platforms.
These tools offer essential insights into audience behavior, engagement trends, and content performance. Because they provide first-party data, they tend to be highly accurate, making them a great starting point for tracking metrics.
While native analytics tools provide valuable insights, they are limited to their respective platforms. This means businesses managing multiple social media accounts may find it difficult to compare performance across different networks.
To get a more holistic view of social media efforts, brands should turn to third-party tools like Iconosquare that consolidate metrics from multiple platforms into one place.
While social media analytics tools provide insights into engagement, reach, and follower growth, they don’t always tell the full story.
Many businesses use social media as a way to drive traffic to their website, generate leads, or increase sales. To measure how social media impacts these conversions, additional tracking tools are necessary.
Google Analytics is one of the most powerful tools for tracking website traffic from social media. It helps businesses understand which platforms drive the most visitors, how long users stay on a site, and whether they take desired actions such as making a purchase or signing up for a newsletter. By setting up UTM parameters, brands can track the effectiveness of social media campaigns and measure which posts generate the highest conversions.
For brands running paid social media campaigns, Meta Pixel (formerly Facebook Pixel) is an essential tool for tracking user behavior after they click on an ad. It helps businesses measure conversion rates, retarget visitors who didn’t complete a purchase, and optimize ad performance. Other platforms, such as LinkedIn and TikTok, offer similar tracking solutions (LinkedIn Insight Tag and TikTok Pixel) that provide data on how social media users engage with a website after seeing an ad.
For businesses and marketers looking to track their social media performance across multiple platforms, Iconosquare stands out as one of the best cross-platform analytics tools. You can track 100+ social media metrics in one single dashboard.

With Iconosquare, you can easily find out whether your social media strategy is working or not.
You can analyze your top-performing posts, discover what kind of content resonates best with your best audience, and determine the best time to post on each social platform. With a single click, you can also export any data as a CSV file or visual data.
Want to try out Iconosquare’s suite of features? Start a free trial now.
![Iconosquare is free for 14 days! With Iconosquare, take your social media in another level. Experience the easiest-to-use platform on the market for free ��{{ include_custom_fonts({"Gilroy":["Audacieux","Moyen","Semi-gras"]}) }}](https://hubspot-no-cache-eu1-prod.s3.amazonaws.com/cta/default/143669362/interactive-258640909509.png)

Freelance B2B and SaaS content marketer specializing in social media marketing. Featured in Social Media Examiner, VWO, GetResponse, Mention, WordStream, and AdRoll, Marvellous writes long-form guides on social media strategy and community growth; helping SMMs, agencies, and brands build strong audiences and drive real results across every platform.
With Iconosquare, take your social media in another level. Experience the easiest-to-use platform on the market for free 💙